July 2026 Active Portfolio Update: Portfolio Declines 1.80% After Reaching a New Intramonth High
Gains in several holdings were offset by sharper declines in a concentrated group of positions, while the AP held up better than the broader microcap benchmark.

The Active Portfolio (AP) declined 1.80% in July, ending the month at $386,522.79, compared with $393,616.54 at the end of June. Since inception on May 22, 2022, the portfolio has generated a return of 286.52% and a CAGR of approximately 38% from its original $100,000 starting value.
The portfolio reached a new intramonth peak cumulative return of 297.75% before giving back part of those gains. Performance was highly selective. Advances in $HMM.A, $RFIL, and $ACFN were outweighed by deeper declines in $FSI, $OCC, and $TGEN.
July’s return compared with a 0.03% decline in SPY and a 6.19% decline in the iShares Micro-Cap ETF. The AP lagged the nearly flat performance of large-cap benchmark but outperformed the broader microcap market by more than four percentage points.
To see the Corporate Actions related to the stocks in the AP, such as dividends, please go here. To see all the stocks in the AP, please go here.
The chart below shows a quick view of how Active Portfolio capital is distributed across sectors at month-end:
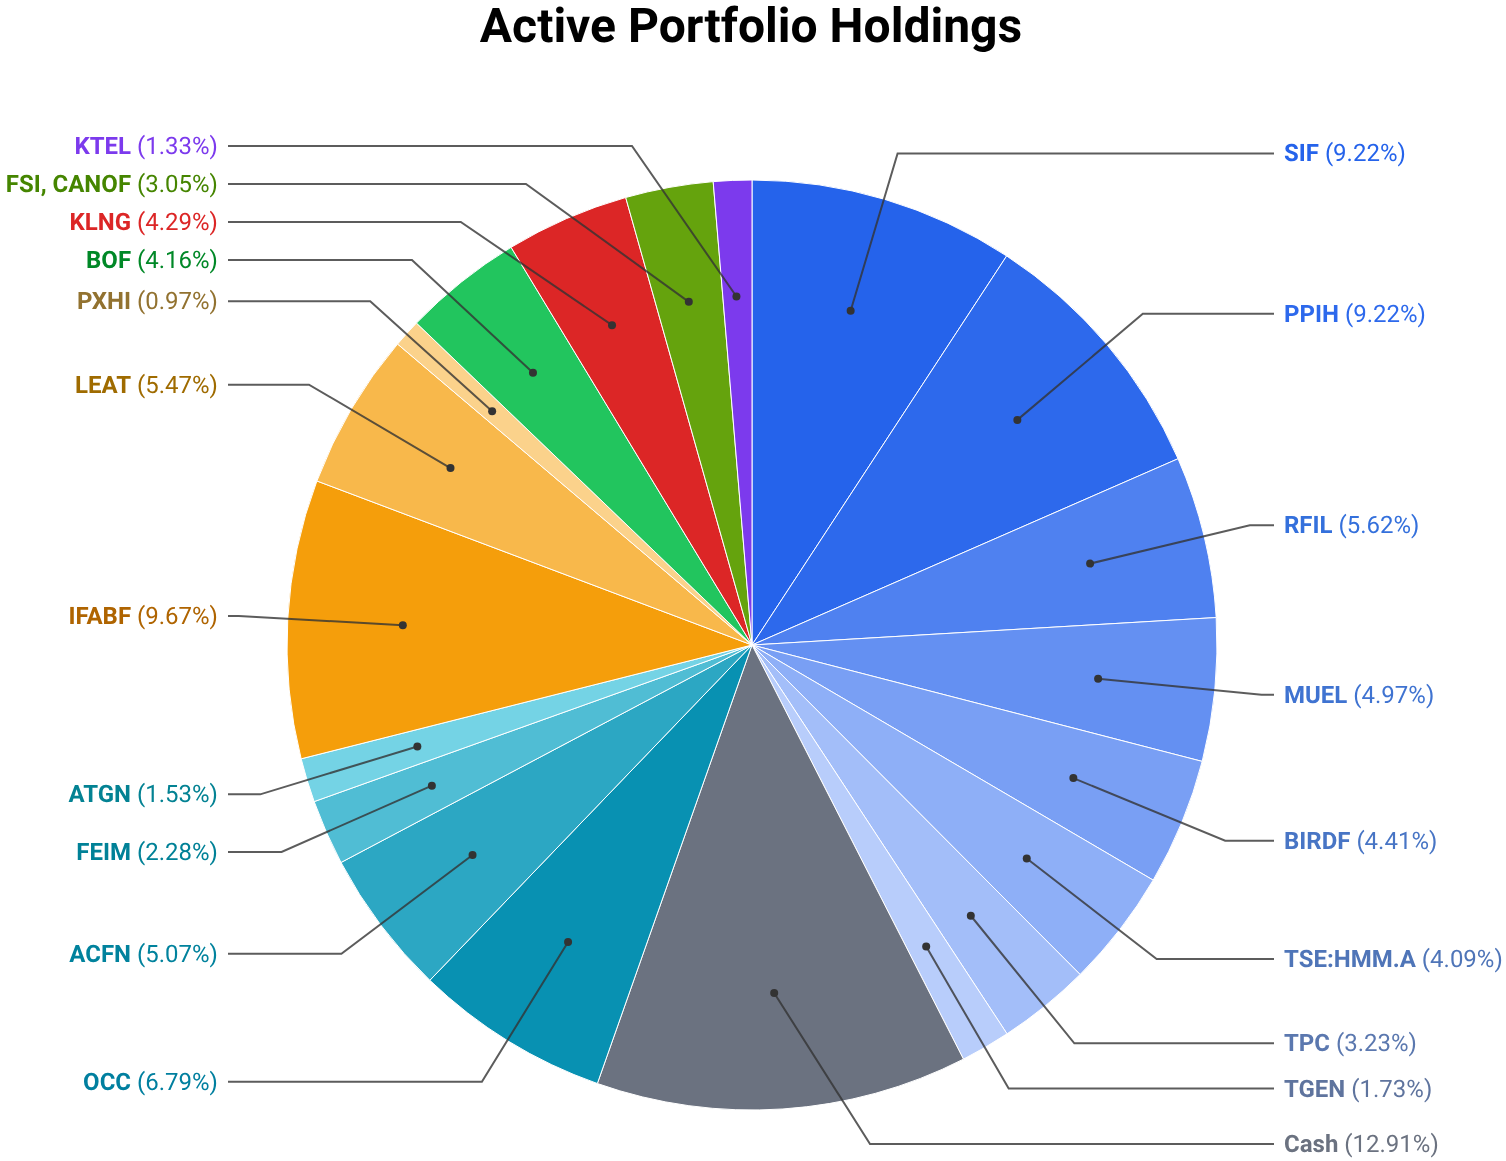
The chart below shows how Active Portfolio capital was allocated across the stocks it holds at the end of June.